DIGitalS - Project controls solutions aimed at Residential & Commercial construction sectors
What DIGitalS is about?
Hello, my name is DIGitalS!
As we all know, project controls reports in EPCM and EPC world will involve: weekly and/or monthly construction reports; executive dashboards & charts.
DIGitalS showcases a project controls digital data platform meant for EPCM and EPC firms to perform their project reports through an application designed according to construction rules.
DIGitalS is meant for custom construction reports, ready dashboards, interactive and dynamic visualizations & graphs.
DIGitalS is meant for using digital data technologies which at present are available to be applied to mobile applications
LET'S WORK TOGETHER!
TO OWNERS & INVESTORS
DIGitalS puts at your disposal
A project controls dashboard.
Designed so you can visualize your progress reports data in an easy-interactive view
As the best way to analyze and compare your real performance with planned performance.
To then make the necessary adjustments to achieve your goals.
DIGitalS also puts at your disposal
Graphs
Designed to unleash that potential and translate it into the development of your own mobile applications
A dashboard that can apply to Residential & Commercial projects
A Panel designed as a template that can be customized
The following is a brief explanation of how this template works out
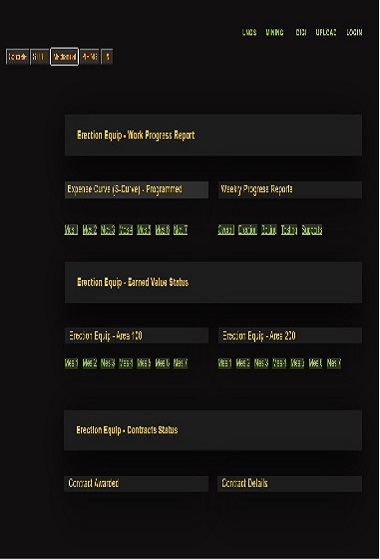
The buttons at the upper left side (colored in orange) let users to interact with construction disciplines; each discipline has been designed to show two main categories: 1) work progress reports; 2) contracts status reports
Then each subcategory (construction report, disciplines report, earned value analysis, disciplines status) will expose its respective graph report. User must click on each input (colored in yellowgreen) one at a time to visualize the graphs
Every time the user click on an input the screen will show only the grapgh being clicked; each time the user click on another input the graph previously showed will disappear to let room for the new graph to appear
Notes: 1) when hovering over an input, the cursor does not show the little hand but the vertical symbol Ⅰ; click when you see the symbol; 2) on project & estimate pages, the panels are presented as a demo, that is, in most cases, only the first entry of each subcategory is enabled to display a graph.
LET'S WORK TOGETHER!
TO PROJECT STAFF
DIGitalS has been created for project contruction engineers
to reach out the ones who work in sectors
which involve oil & gas and residential & commercial
DIGitalS wants to connect with you
to show you an easy way to venture into data technologies with focus on techs related to project controls
to lead the way of your current generation
PANEL DESCRIPTION
This panel will show you monthly work reports and analysis as listed below:
SECTION: OVERALL
• PROJECT SCHEDULE
This chart shows the duration of the contracted Work; shows the execution period for each of the planned activities.
• SITEWORK - ONLINE VIEWS
This is a web camera application for construction, its use can be programmed for any point of work; the implementation of this application is conditioned to the will of the client; prior agreement, DIGI would take care of all the details.
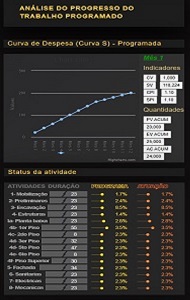
• EXPENSE CURVE PROGRAMMED
A chart that includes the relationship between direct cost, indirect cost, current month cost and accumulated monthly cost
• TRENDS – DIRECT COSTS
A graph designed to show the evolution of trends during the execution of the Project.
• MATERIALS PRICE EVOLUTION
A chart that shows the variation in prices of materials (if any) during the execution period of the Work
• EQUIPMENT LIST
A list of machinery and equipment offered for the execution of the Work is included
• PROJECT MATERIAL INVENTORY - ABC Analysis
This graph shows the application of a material inventory management technique in the construction of a Project.
• MONTHLY CASHFLOW
A chart that allows you to view and analyze the Monthly Cash Flow of the contracted Work; DIGI will render the excel data of your accounting area.
SECTION: CONSTRUCTION DISCIPLINES
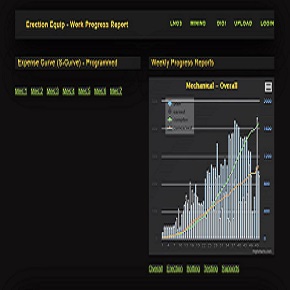
• CONSTRUCTION PROGRESS REPORT
A chart showing the accumulated monthly man-hours in relation to the programmed monthly man-hours; for all construction disciplines.
• EARNED VALUE REPORT
A chart designed to evaluate project performance in terms of man-hours spent vs. scheduled man-hours.
• DISCIPLINES WEEKLY REPORTS
A graph showing the accumulated weekly man-hours in relation to the programmed weekly man-hours; for a particular construction discipline.
• DISCIPLINES STATUS REPORTS
A graph designed to show the monthly progress of each construction discipline in terms of percentage (%), including the breakdown in each one in their respective items. The user must place the cursor on each of the columns displayed (representing each discipline), then click to see the breakdown of items for that discipline and their respective advances in %.
• LIST OF CONTRACTS
This list specifies both the services contracted for the current month, as well as the services to be subcontracted in the following months.
• SERVICE DETAILS
This service detail information is used to show how the expense values of said service are progressing to the current month.
Showing possible additions to the amount of service; changes in amount arising during the execution of the work; amount of service spent to date; amount of service to be spent; other details to show according to the builder's requirement.
ATELIER & GRAPHS
These are web programming learning components, which have been designed to make it available to engineers who work in the Project Control area; who have not yet developed their skills regarding programming code
Editor Web
To facilitate this learning, 'Atelier' like 'Graphs' has two (02) parts: the first is the explanation that is given about the subject that is being presented; then the second part is the 'web editor' where both the 'code' of the exercise and its 'rendering' are displayed, and where the user can make changes to the code presented to implement its advance in programming.
TO JUNIOR ENGINEERS
DIGitalS has its arms open-wide to junior engineers
who are willing to venture into the world of digital data technologies
to exercise programming with focus on data related to project controls
And in doing so be at the front-end of their generation
to lead the way in the residential and commercial sector.
Data technologies have touched the doors of the construction industry
DIGitalS advises you to develop your own digital data solutions for your project portfolio
GET IN TOUCH!
DIGitalS is committed to promote digital data solutions that applied to the world of project controls.