It is relatively easy to start developing graphics. All that is required is the script included in the page along with a single canvas or container node to render the chart.
The use of a canvas node or a container node depends on the library that you want to use to develop the graphic.
There are several bookstores on the market; Some are for free use, others are for commercial use; on this platform we will only talk about free use libraries.
Now, about line charts let's start by saying that they are usually used to show trends (trends)
Line charts are wildly popular for a variety of business use cases because they demonstrate an overall trend quickly and concisely in a way that is hard to misinterpret.
In particular, they are good at representing trends for different categories over the same time period, for easy comparison.
In engineering terms: line graphs are useful when you want to show changes in value of a given variable with respect to changes in some other variable; the other variable is usually time.
Example 1, shows line graphs used to show the speed of a vehicle during specific time intervals.
Example 2, shows how you can also draw multiple lines on a single graph and provide different options to draw each of them.
Bar charts
Section 1
Bar charts are great for comparing several different values, especially when some of these fall into color-coded categories.
Bar charts are useful when you want to compare a single metric for different entities --- for example, the number of cars sold by different companies or the number of people in certain age groups in a town.
For example, using the Chart.js library you can create bar charts by setting the type key to bar. By default, this will create graphs with vertical bars. If you want to create charts with horizontal bars, you will have to set the type to horizontalBar.
Example 1: Let's create a bar graph that plots the density of all the planets in our solar system. The density information has been taken from the Planetary Data Sheet provided by NASA.
Example 2: Let's make the density graph more interesting by overriding the default values for bar graphs using the following code. Afterwards, the type of the graph has been set to horizontalBar this time.
Bar charts
Section 2
In Section 1, we defined that a bar graph can be vertical or horizontal and we show examples of this. Now we are going to talk again about the vertical type bar graph but referred to as column graph; because some libraries prefer to use the terms column and horizontal chart instead of bar chart
Column charts are great for comparing values side by side; they are used to show changes over a period of time, when you want to draw attention to the total figures.
It usually makes sense to use column charts for side-by-side comparisons of different values.
Example 3, takes as a basis values shown in Examples 1, 2 to represent the statement above
A considered use of experts is that: when you want to highlight or contrast key figures with a general trend, you usually combine a column chart with a line chart:
Example 4: shows what is called a Stacked Column chart, which consists of representing the data as stacked columns to compare quantities; which is an essential feature of column charts; they are often used to visualize data that accumulates into a sum; These charts show data labels for each individual section of the stack.
Pie and Doughnut charts
Pie charts and Donut charts are useful when you want to show the proportion in which something is split between different entities
The pie charts clearly show the proportions; They easily show the part that each value makes up of the whole. They are much more intuitive than simply listing percentages that add up to 100%.
Important: For a pie chart to be effective, it must have six or fewer categories; more than that and the graph will be too crowded and the values will be too indistinct to get information.
Example 1 is a pie chart showing oil export data for the top five countries in 2020. The data is in billions of US dollars.
Example 2, is a donut chart with the same data xe Example 1; where setting the rotation value equal to -Math.PI takes that starting point 180 degrees counterclockwise; then setting the circumference value in Math.PI makes the graph only span a semicircle.
Scales 1
Changing Grid Lines
You can show or hide the grid lines of a graph using the display key; its initial value is true, so the grid lines are displayed by default
The color of the grid lines can be specified using color key.
If you want the grid lines to be made up of dashes instead of solid lines, you can provide a value for the length and spacing of the dashes as the borderDash key value.
You can set the width and color of the lines for the first or zero index using zeroLineWidth and zeroLineColor keys respectively.
Example 1: Show the same car speed chart, specifying a different set of chart options.
Configuring Linear Scales
Linear scales are used to graph numerical data. These scales can be created on the x-axis or on the y-axis
In most cases, the libraries automatically detect the minimum and maximum values of the scales; however, this can result in some confusion.
If you want to graph grades; If the maximum marks were 200 but no student obtained more than 180 points, the scale will reach a maximum of 180; In such cases, the reader will have no way of knowing whether the maximum grades were 180 or 200.
Example 2: Shows the code to specify the minimum and maximum scale values for the horizontal scale in the bar chart for a previous tutorial in this series.
Scales 2
Configuring Time Scales
You can show or hide the grid lines of a graph using the display key; its initial value is true, so the grid lines are displayed by default
The color of the grid lines can be specified using color key.
If you want the grid lines to be made up of dashes instead of solid lines, you can provide a value for the length and spacing of the dashes as the borderDash key value.
You can set the width and color of the lines for the first or zero index using zeroLineWidth and zeroLineColor keys respectively.
Example 1: display the same car speed graph, specifying a different set of graph options.
Configuring Radial Linear Scales
Linear scales are used to graph numerical data. These scales can be created on the x-axis or on the y-axis
In most cases, the libraries automatically detect the minimum and maximum values of the scales; however, this can result in some confusion.
If you want to graph grades; If the maximum marks were 200 but no student obtained more than 180 points, the scale will reach a maximum of 180; In such cases, the reader will have no way of knowing whether the maximum grades were 180 or 200.
Example 2: Shows the code to specify the minimum and maximum scale values for the horizontal scale in the bar chart for a previous tutorial in this series.
Graphs: Basis 2
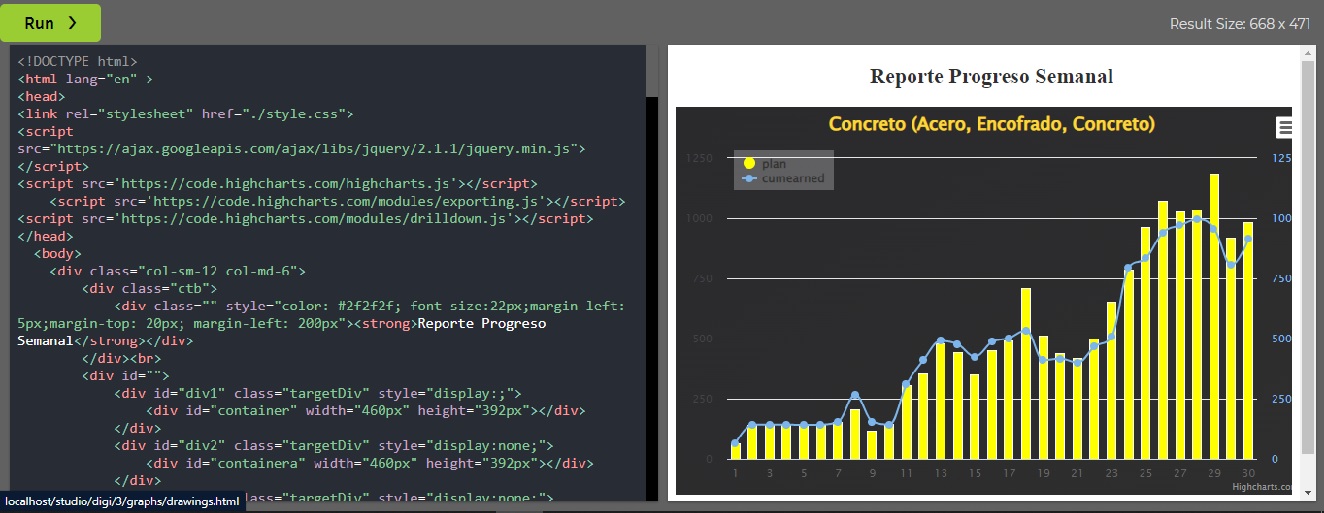
Dual axes: line & column
Graph showing a combination of column and line chart, using several Y axes
The use of several axes allows the data to be displayed together in different ranges.
The example presented shows a weekly project progress report.
Multiple Axes
Graph showing the use of multiple y-axes, where each series has a separate axis.
Multiple axes allow data to be displayed together in different ranges.
Which makes them a powerful tool for illustrating correlations.
Set New Data
Graphic showing the use of buttons to reproduce two new data series in a single container.
To achieve this, the script combines the search method document.getElementById with an addEventListener
Then, to return to the original series, the page must be updated
Data visualization
THIS EXERCISE SHOWS HOW TO GENERATE A CHART IN HIGHCHARTS COMBINED WITH THE JQUERY.DATATABLE LIBRARY
THE EXERCISE IS PRESENTED IN ORDER FOR THE READER TO GET FAMILIAR WITH THE STRUCTURE OF THIS TYPE OF SCRIPT
TO TEST YOURSELF YOUR UNDERSTANDING OF SCRIPT, DO NOT HESITATE TO START MAKING CHANGES AND SEE YOUR RESULTS
Chart Toggle
THIS EXERCISE SHOWS HOW TO TOGGLE BETWEEN DIFFERENT GRAPHICS USING BUTTONS
THE EXERCISE IS PRESENTED IN ORDER FOR THE READER TO GET FAMILIAR WITH THE STRUCTURE OF THIS TYPE OF SCRIPT
CONCENTRATE YOUR UNDERSTANDING ON THE SCRIPT LOCATED INSIDE THE TAGS BODY; IN THE FINAL PART THAT BEGINS WITH $(document).on('click', '.chart-update', function() {
Changing Chart type
ANOTHER EXERCISE THAT SHOWS HOW TO TOGGLE BETWEEN DIFFERENT CHRTSS, IN THIS CASE WITH THE USE OF RADIALE BUTTONSS
THE EXERCISE IS PRESENTED IN ORDER FOR THE READER TO GET FAMILIAR WITH THE STRUCTURE OF THIS TYPE OF SCRIPT
CONCENTRATE YOUR UNDERSTANDING OF SCRIPT IN THE PART THAT BEGINS WITH THE COMMENT: // Column chart
Graphs: Projects
Construction Progress
This graph will show the accumulated monthly man-hours in relation to the programmed monthly man-hours; for the total package of work disciplines (earthworks, structural concrete, equipment, pipes, electrical installations, etc.)
that have been consumed for the execution of the work during the month analyzed; in order, to plan to comply with the construction schedule
this exercise takes the data from a json file; they will see the path specified in the script in $.getJSON('json/data_day3.json', function(json) {
Disciplines Progress
this exercise reports the accumulated weekly man-hours in relation to the programmed weekly man-hours; in this case, for the work discipline: structural concrete.
the exercise is designed to toggle between charts named: overall, rebar, formwork, pouring.
then this exercise, like the previous one, will take the data from a json file; therefore, there will be a json file for each programmed graphic, mentioned lines above.
Disciplines Status
this is a chart designed to show:
1) the monthly progress of each construction discipline, made in terms of percentage ( % )
2) include the breakdown of each discipline in its main work activities, and also show the progress in percentages
Note: to see the breakdown of each discipline, click on each column of disciplines
then, to return to the main chart, click on the 'Back to items' button
Earned Value Report
Earned Value Analysis is a quantitative project management technique for evaluating project performance and predicting final project results, based on comparing the progress and budget of work packages with planned work and actual costs.
Earned Value Analysis uses three key pieces of project information: planned value, actual value, and earned value.
Earned Value Analysis is the preferred method to measure the progress of mega projects in the Oil & Gas sector.
from this format, the cost variance and the project schedule variance are usually calculated; that is, it is used to predict cost overruns and delays in scheduling.
the exercise shown presents real data obtained during the execution of an LNG project
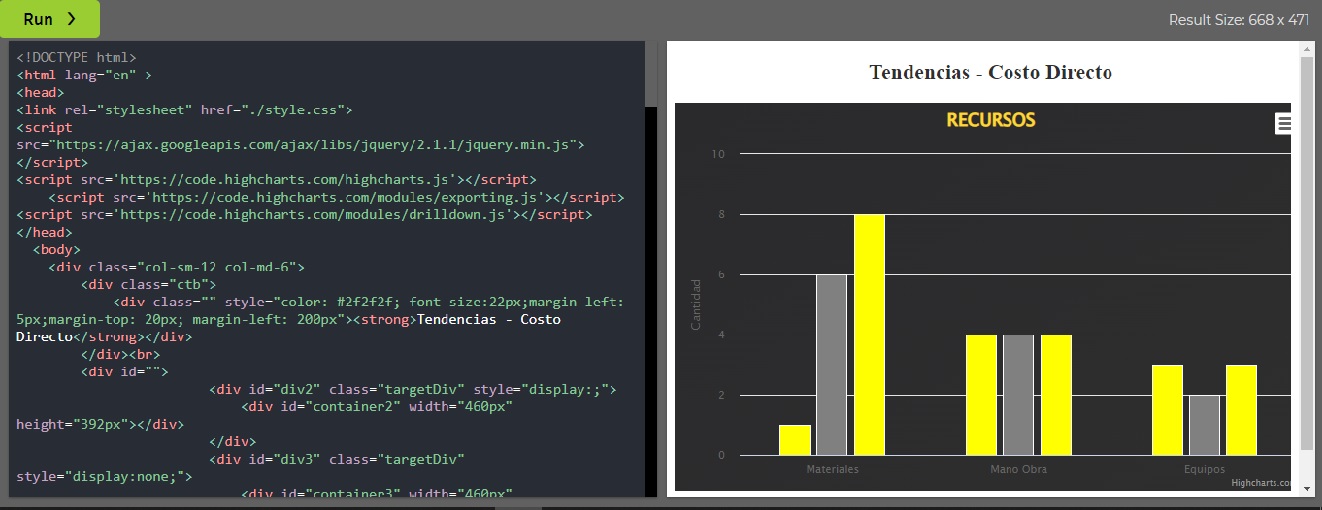
Trends - Direct Cost
A chart designed to show:
1) a follow-up of the expenses necessary for the construction work, such as: a) resources of materials, labor, equipment; b) services such as: design, laboratory, geotechnics, topography, others; c) materials such as concrete, steel, formwork, reinforcement, others;
2) monitor the management of the work (construction management, internal resources, subcontracts);
3) produce a weighting on the incidence of resources (cement, operator, laborer, steel, embankments, etc.) in the work budget.
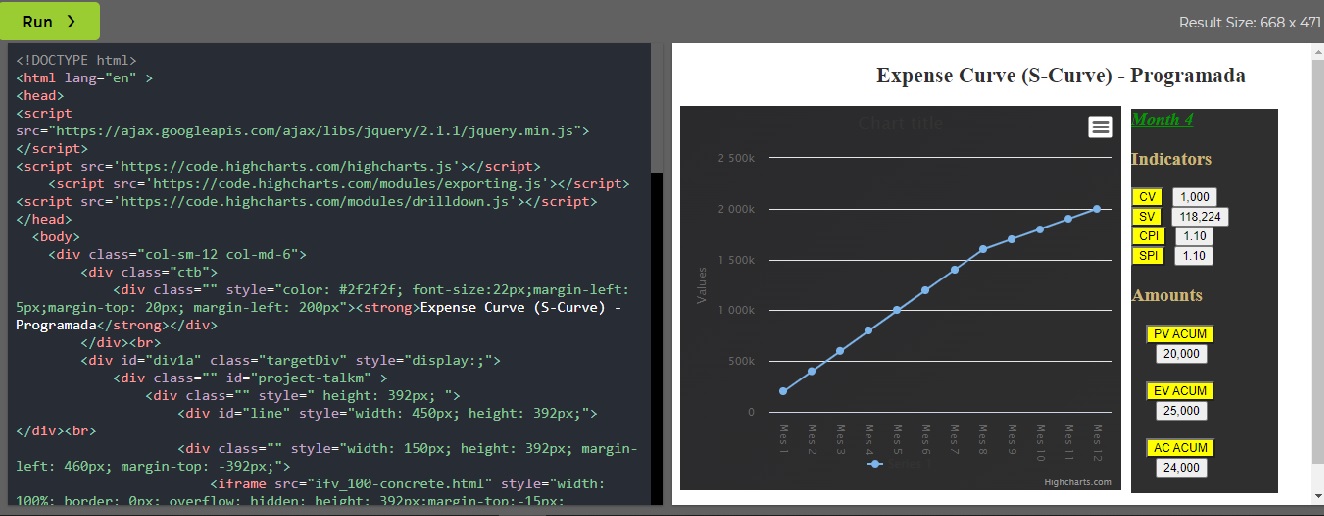
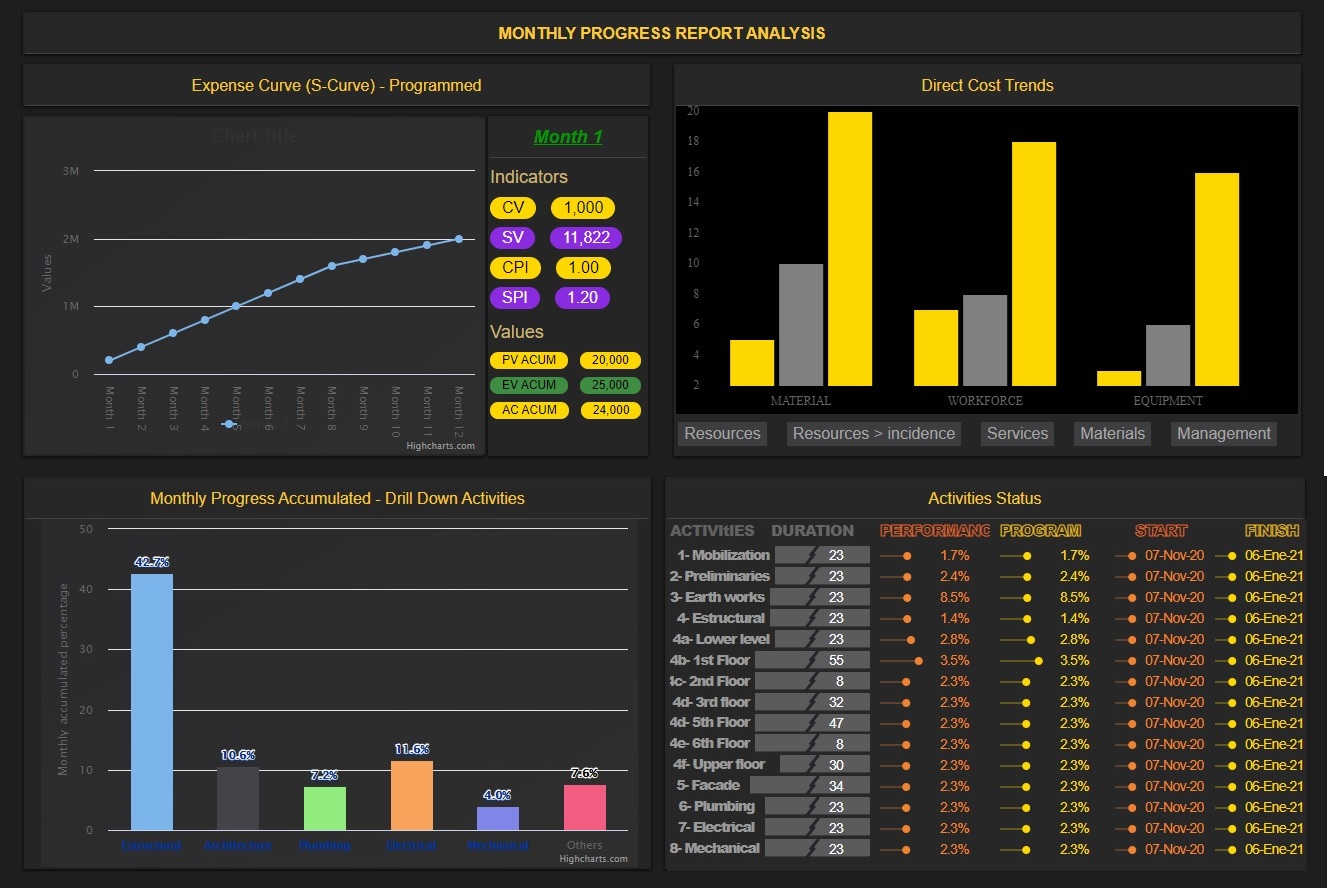
Expenses S-Curve
A graph that includes the relationship between direct cost, indirect cost, current month's cost, and accumulated monthly cost; where:
the indicators will show: a) if the project is ahead or behind schedule (SV); b) if the project is in an over or under budget condition, that is, savings or losses (CV); c) the profitability of the work performed (CPI); d) schedule efficiency or progress (SPI)
the values in turn, will compare what was programmed (PV) vs what was executed (EV) and the real cost (AC)
the indicators and values will make it easier to appreciate the real cost of the analyzed month; through an interactive process where actual performance is compared with planned performance, to make the necessary adjustments; then the process is repeated, each time, in the following months.
Graphs: Dashboards
Highcharts dashboard
To be commented soon
for now, the exercise is presented so that the reader becomes familiar with the html structure of this dashboard
do not hesitate to start making changes to test yourself your understanding of the html document
Flat dashboard
To be commented soon
for now, the exercise is presented so that the reader becomes familiar with the html structure of this dashboard
do not hesitate to start making changes to test yourself your understanding of the html document
Economy dashboard
To be commented soon
for now, the exercise is presented so that the reader becomes familiar with the html structure of this dashboard
do not hesitate to start making changes to test yourself your understanding of the html document
Project Management
To be commented soon
for now, the exercise is presented so that the reader becomes familiar with the html structure of this dashboard
do not hesitate to start making changes to test yourself your understanding of the html document
Project Milestones
To be commented soon
for now, the exercise is presented so that the reader becomes familiar with the html structure of this dashboard
do not hesitate to start making changes to test yourself your understanding of the html document
Testing
To be commented soon
for now, the exercise is presented so that the reader becomes familiar with the html structure of this dashboard
do not hesitate to start making changes to test yourself your understanding of the html document
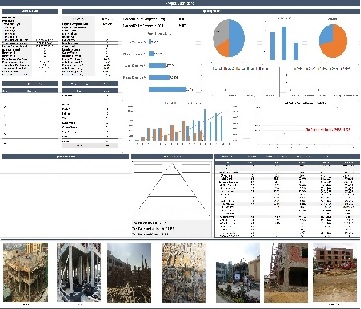
Graphs: Project Dashboard
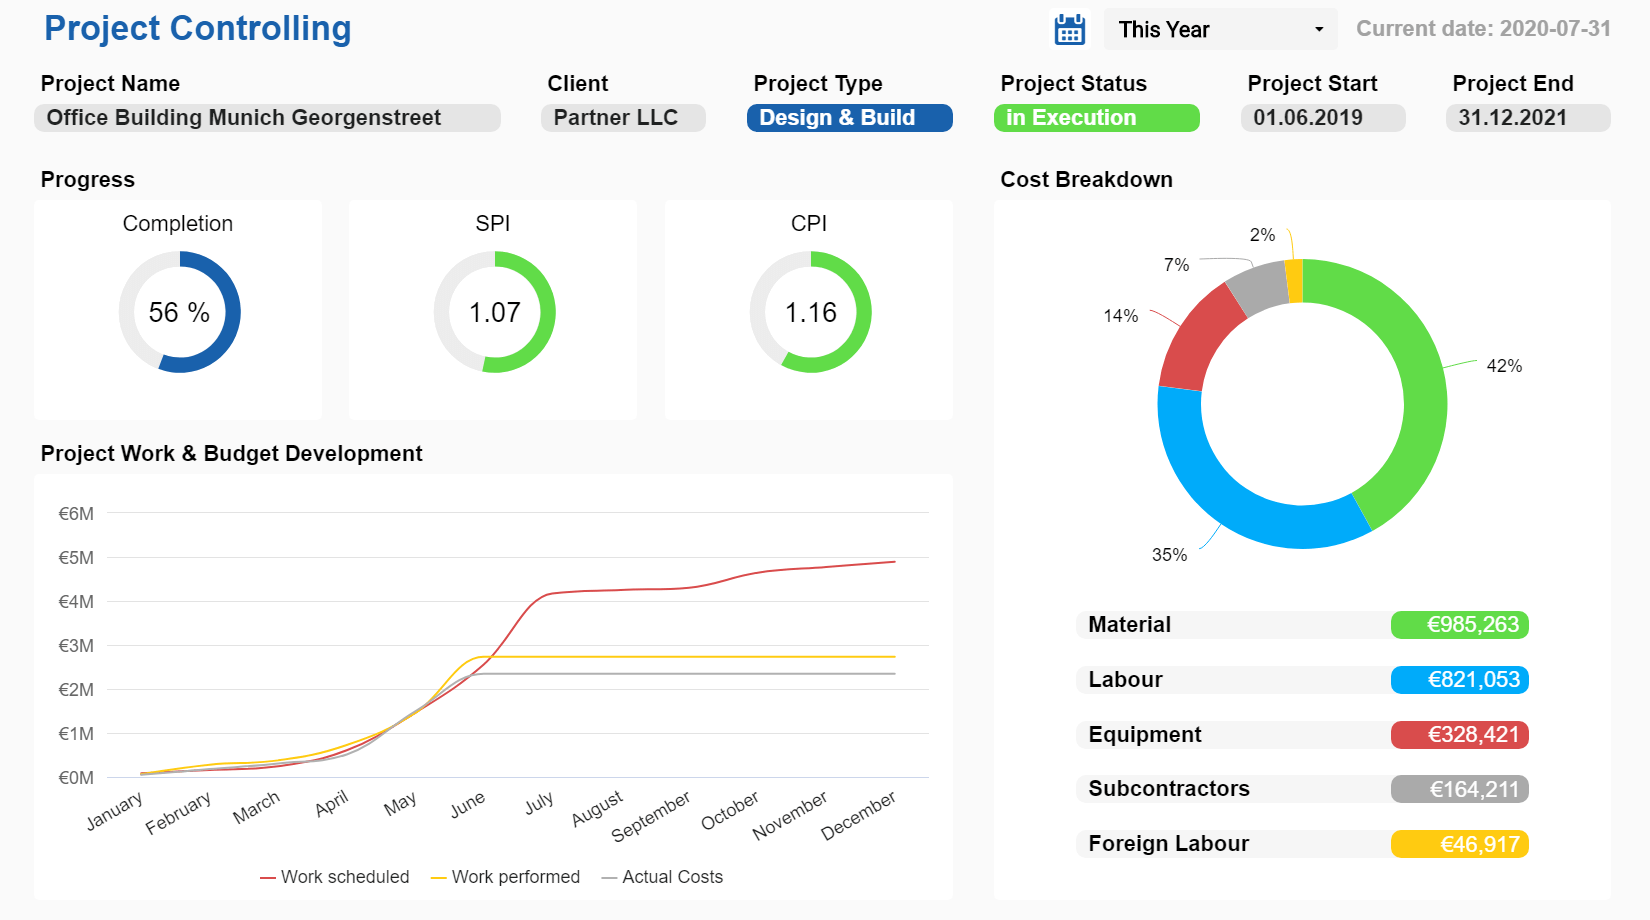
Practice 1
Practice to be commented soon
for now, the practice is presented so that the reader:
first, analyze the graphic design of this dashboard (download the image)
second, convert that analysis into html elements (headers sections divs columns others); on a paper
then go to the editor and start developing a draft of the HTML document
then make corrections in the draft and see results
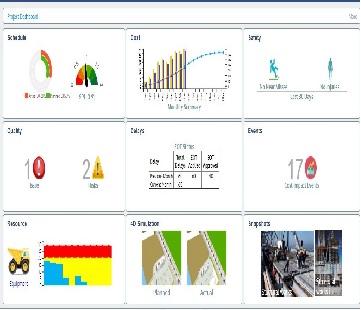
Practice 2
Practice to be commented soon
for now, the practice is presented so that the reader:
first, analyze the graphic design of this dashboard (download the image)
second, convert that analysis into html elements (headers sections divs columns others); on a paper
then go to the editor and start developing a draft of the HTML document
then make corrections in the draft and see results
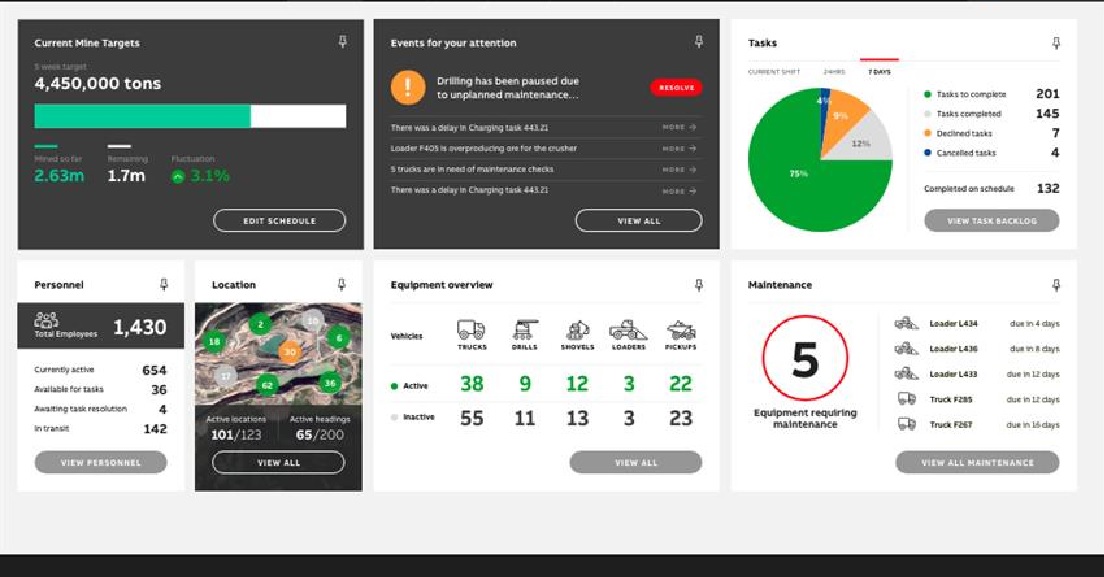
Practice 3
Practice to be commented soon
for now, the practice is presented so that the reader:
first, analyze the graphic design of this dashboard (download the image)
second, convert that analysis into html elements (headers sections divs columns others); on a paper
then go to the editor and start developing a draft of the HTML document
then make corrections in the draft and see results
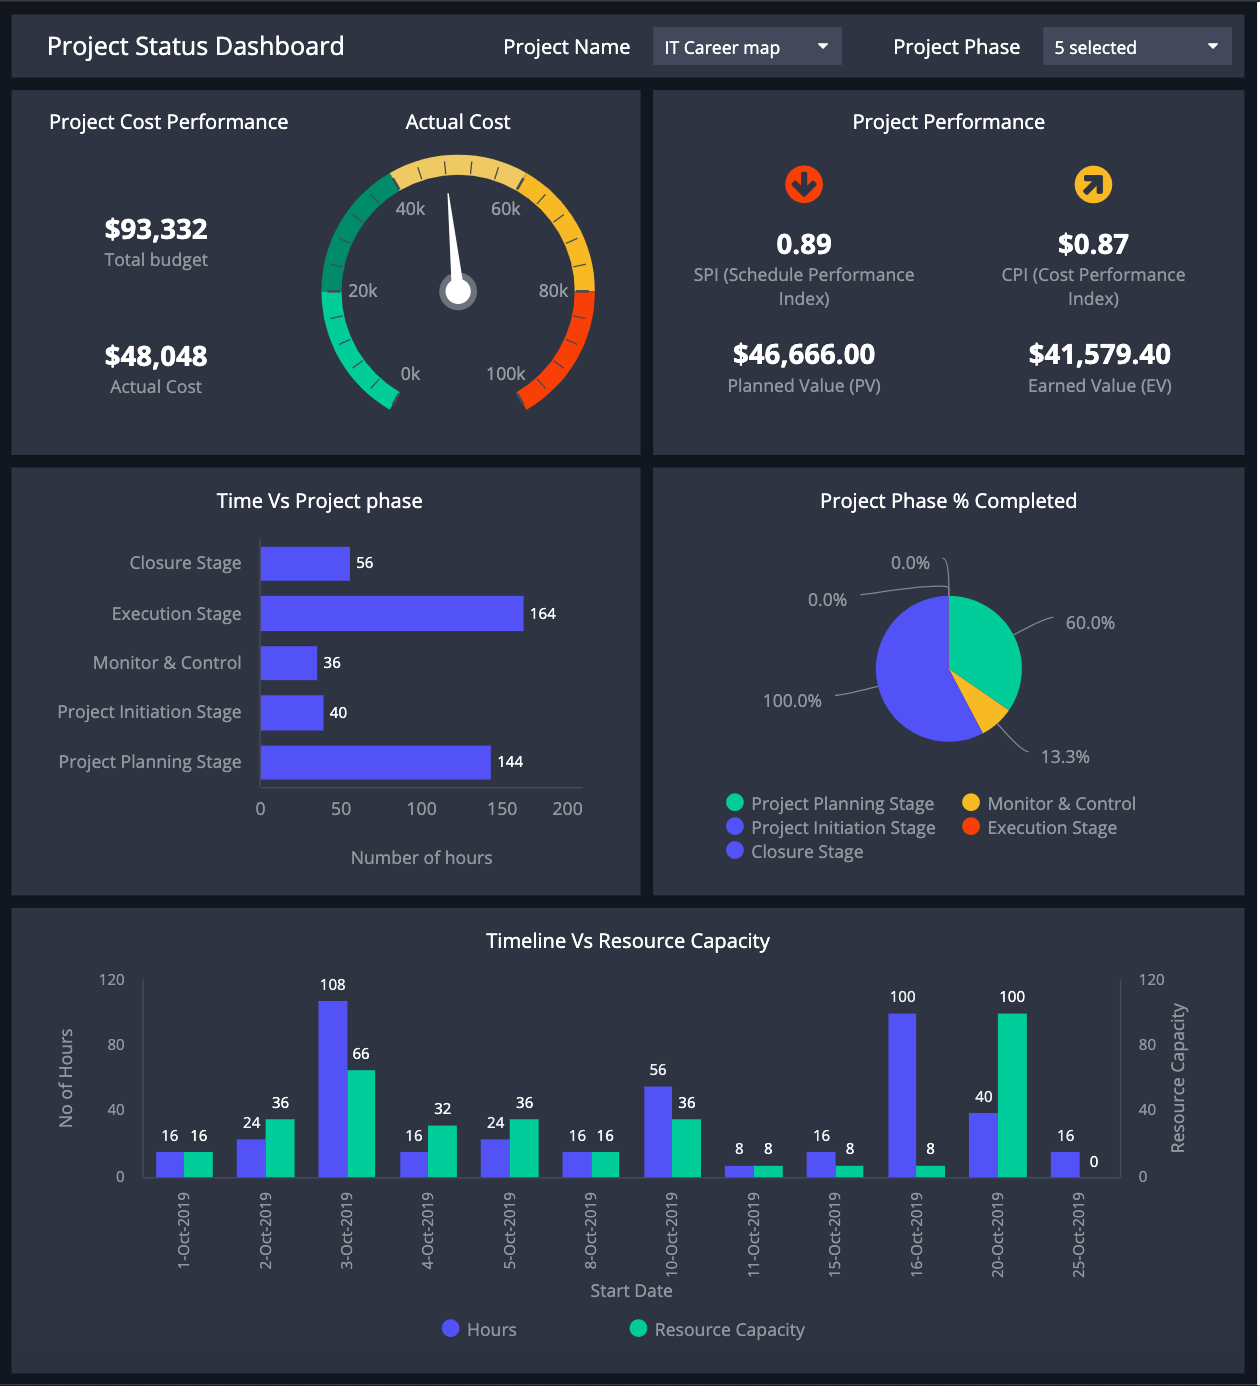
Practice 4
Practice to be commented soon
for now, the practice is presented so that the reader:
first, analyze the graphic design of this dashboard (download the image)
second, convert that analysis into html elements (headers sections divs columns others); on a paper
then go to the editor and start developing a draft of the HTML document
then make corrections in the draft and see results
Practice 5
Practice to be commented soon
for now, the practice is presented so that the reader:
first, analyze the graphic design of this dashboard (download the image)
second, convert that analysis into html elements (headers sections divs columns others); on a paper
then go to the editor and start developing a draft of the HTML document
then make corrections in the draft and see results
Practic6 6
Practice to be commented soon
for now, the practice is presented so that the reader:
first, analyze the graphic design of this dashboard (download the image)
second, convert that analysis into html elements (headers sections divs columns others); on a paper
then go to the editor and start developing a draft of the HTML document
then make corrections in the draft and see results